Published Articles & Blogs

Published Articles


|
January/February 2022.
|
Blogs
|
To see additional blog posts, click the 'previous' link at bottom of page
|
|
|
January/February 2022.
|
|
To see additional blog posts, click the 'previous' link at bottom of page
|
AuthorsDeb Dietz, CEO Archives
January 2022
|
Back to Blog
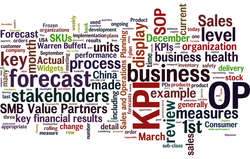 Blog post by Charlie DietzS&OP is a business process used by many organizations across many different industries, business types, organization sizes and structures (including for-profit and non-profit entities). At its basic function, the S&OP process allows an organization to regularly review its consumer / customer / client demand, and key organization performance against these forecasts and production / execution plans. It has a tactical / strategic focus, as it generally is looking in time units of your planning cycle (generally monthly, but sometimes weekly (retail) or quarterly or longer (capital equipment)). The key process of S&OP is the periodic, scheduled mandatory meeting of the stakeholders of the business to review the key business KPIs, at a level of detail appropriate to the business, and agree on forward plans. A CPG company selling thousands of SKUs would typically present performance measures at a product class or sub-class level. A food processing company having few end items would review performance at the SKU level. A non-profit / association would review key operating variables against plan (membership growth/retention, conference registration, sponsorship sales, fundraising/development revenue, web visits/conversions, etc.). KPI Example: For many organizations where there are ongoing sales of products that must be made or procured, one helpful tool is the S&OP Waterfall Forecast and Sales KPI display, a stylized version shown here: For the Product sub-class: Consumer Widgets (imported from China), representing a summation of the Consumer Widgets, the time to plan, make/procure, and have a widget available for sale is 3 months. So in March of this year, our current month, we have a current proposed forecast of 200, 130, 125, 125, 100 units for March through July. We need to understand a few things:
There are also other KPIs that would be more operational (day-to-day, weekly).
Outside experts with S&OP creation and implementation experience can work with your stakeholder team to speed the design, process development and implementation of KPIs and a S&OP process customized for your organization. The key values to the business of the S&OP process is the development of meaningful KPI measures of the business’ health, the discussion between the key stakeholders over past and current KPI results, and what can be done to continue improvements in all the operations of the business.
0 Comments
Back to Blog
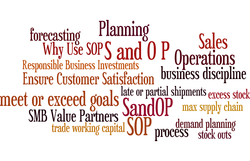 Blog post by Jim Scarlata In the first post in the SMB Value Partners’ Series on S&OP, I described the “what” of Sales and Operations Planning (S&OP), what it means and how it can be successfully deployed in any type or size of organization. Here in our second post, I’ll describe the “why you should care” about this important business discipline. For most organizations the benefits clearly align to the firm’s financial goals and plans. In one relevant example from my personal experience, a large manufacturer focused its scrutiny on trade working capital (TWC) against financial goals. (TWC can be simply defined as the difference between current assets and current liabilities directly associated with everyday business operations). Of course the level of finished goods and raw inventories significantly impacts this metric. In companies focused too stringently on inventory cost, reductions in inventory can negatively impact customer satisfaction (stock-outs, late or partial shipments). Many times firms under strong financial pressures are willing to accept these impacts in order to meet short-term (e.g. end of quarter or year) financial objectives. We at SMB Value Partners do not subscribe to this as an effective long-term strategy; if practiced for any significant periods of time it will greatly impact customer satisfaction, and can also increase competition for your customers’ business. The more important reasons for implementing a rigorous S&OP discipline is quite simply to ensure customer satisfaction and make responsible business investments.
While leading the demand planning / forecasting function for former employers, I always had the above two points in mind when the forecasts were challenged by senior management. Experience showed that the quality of the forecasts and the overall S&OP process, especially when involving the proper company functional disciplines, positively affected both product inventories and resultant customer satisfaction. In today’s marketplace, customers have many more options than in the past, and a firm that maintains a healthy S&OP process ensures meeting financial AND customer satisfaction goals. One way to assure this is to include questions related to these metrics in customer/client satisfaction surveys; e.g. “Company X always has the products I want when I need them” or “Company Y’s products are at the locations I buy from.” Examining changes in customer responses over time can identify problem areas before they occur or cause measurable damage. Let SMB Value Partners help you examine your existing S&OP process and results, or help you set up a S&OP discipline for your business. |
|
|
|
|
|
|
|
|
www.smbdigitaledu.com SMB Digital Education
Copyright 2021 SMB Value Partners, Inc All rights reserved |
 RSS Feed